Georgia's 5th congressional district
U.S. House district for Georgia
| Georgia's 5th congressional district | |
|---|---|
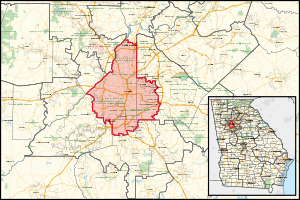
    Interactive map of district boundaries | |
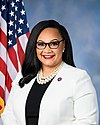
| Representative | Nikema Williams D–Atlanta |
| Distribution |
|
| Population (2022) | 759,771[2] |
| Median household income | $80,430[3] |
| Ethnicity |
|
| Cook PVI | D+32[4] |
Georgia's 5th congressional district is a congressional district in the U.S. state of Georgia. The district was represented by Democrat John Lewis from January 3, 1987, until his death on July 17, 2020. Kwanza Hall was elected to replace Lewis on December 1, 2020, and served until January 3, 2021, when Nikema Williams took his place. Hall was elected in a special election for the balance of Lewis' 17th term. He chose not to run in the general election for a full two-year term, which was won by Williams.
Reapportionment
The district's boundaries were redrawn following the 2010 census, which granted an additional congressional seat to Georgia.[5] The first election using the new district boundaries (listed below) were the 2012 congressional elections.
Geography
Based in central Fulton and parts of DeKalb and Clayton counties, the majority black district includes almost three-fourths of Atlanta, the state capital and largest city. It also includes some of the surrounding suburbs, including East Point, Druid Hills, and Forest Park.[6] With a Cook Partisan Voting Index rating of D+32, it is the most Democratic district in Georgia.[4]
Counties
- Fulton (Partial, see also 6th district, 11th district and 13th district)
- DeKalb (Partial, see also 4th district)
- Clayton (Partial, see also 13th district)
Recent results in statewide elections
| Year | Office | Results |
|---|---|---|
| 2000 | President | Al Gore 73% - George W. Bush 27% |
| 2004 | President | John Kerry 74% - George W. Bush 26% |
| 2008 | President | Barack Obama 84.4% - John McCain 15% |
| 2012 | President | Barack Obama 83.1% - Mitt Romney 15.8% |
| 2016 | President | Hillary Clinton 85% - Donald Trump 12% |
| 2018 | Governor | Stacey Abrams 87.9% - Brian Kemp 11.3% |
| 2020 | President | Joe Biden 86% - Donald Trump 13% |
List of members representing the district


Election results
| Year | Candidate | Party | Votes | % |
|---|---|---|---|---|
| 1844 (29th Congress) |  Y John Henry Lumpkin Y John Henry Lumpkin | Democratic | 7,720 | 61.2 |
| Miller | Whig | 4,889 | 38.8 | |
| 1846 (30th Congress) | Y John Henry Lumpkin | Democratic | 5,349 | 79.4 |
| Crook | Whig | 1,263 | 18.8 | |
| 1848 (35th Congress) | Y Thomas C. Hackett | Democratic | 8,767 | 59.8 |
| James M. Calhoun | Whig | 5,904 | 40.2 | |
| 1851 (32nd Congress) | Y Elijah Webb Chastain | Union | 13,882 | 65.0 |
| Stiles | Whig | 7,481 | 35.0 | |
| 1853 (33rd Congress) | Y Elijah Webb Chastain | Democratic | 8,118 | 50.8 |
| Tumlin | Democratic | 7,866 | 49.2 | |
| 1855 (34th Congress) | Y John Henry Lumpkin | Democratic | 11,290 | 58.6 |
| Tumlin | 7,978 | 41.4 | ||
| 1857 (35th Congress) | Y Augustus R. Wright | Democratic | 9,669 | 63.0 |
| Hooper | Independent Democrat | 5,690 | 37.1 | |
| 1859 (36th Congress) | Y John Underwood | Democratic | 12,339 | 85.1 |
| Shackleford | Opp. | 2,162 | 14.9 | |
| Georgia announced its secession from the Union, January 28, 1861. | ||||
| April 20, 1868 (40th Congress) Special election | Y Charles H. Prince[7] | Republican | ||
| Hilliard | Democratic | |||
| January 1871 (45th Congress) Special election | Y Stephen Alfestus Corker | Democratic | ||
| 1870 (42nd Congress) | Y Dudley M. Du Bose | Democratic | 15,363 | 62.3 |
| Isham S. Fannin | Republican | 9,302 | 37.7 | |
| 1872 (43rd Congress) | Y James C. Freeman | Republican | 10,910 | 50.7 |
| Glenn | Liberal Republican | 10,631 | 49.4 | |
| 1874 (44th Congress) | Y Milton A. Candler | Democratic | 12,450 | 66.5 |
| Mills | Republican | 6,273 | 33.5 | |
| 1876 (45th Congress) | Y Milton A. Candler | Democratic | 18,083 | 67.5 |
| Markham | Republican | 8,714 | 32.5 | |
| 1878 (46th Congress) | Y Nathaniel Job Hammond | Democratic | 10,269 | 55.6 |
| Arnold | Greenback | 8,196 | 44.4 | |
| 1880 (47th Congress) | Y Nathaniel Job Hammond | Democratic | 11,947 | 62.6 |
| Clark | Republican | 7,133 | 37.4 | |
| 1882 (48th Congress) | Y Nathaniel Job Hammond | Democratic | 10,788 | 65.2 |
| Buck | Independent Republican | 5,756 | 34.8 | |
| 1884 (49th Congress) | Y Nathaniel Job Hammond | Democratic | 9,008 | 63.7 |
| Martin | Republican | 5,130 | 36.3 | |
| 1886 (50th Congress) | Y John D. Stewart | Democratic | 2,999 | 100.0 |
| 1888 (55th Congress) | Y John D. Stewart | Democratic | 10,971 | 68.6 |
| George S. Thomas | Republican | 5,032 | 31.4 | |
| 1890 (52nd Congress) | Y Leonidas F. Livingston | Democratic | 8,688 | 70.7 |
| Will Haight | Republican | 3,608 | 29.3 | |
| 1892 (53rd Congress) | Y Leonidas F. Livingston | Democratic | 9,732 | 60.2 |
| Samuel Small | Populist & Republican | 6,447 | 39.9 | |
| 1894 (54th Congress) | Y Leonidas F. Livingston | Democratic | 7,781 | 59.7 |
| Robert Todd | Populist | 5,264 | 40.4 | |
| 1896 (55th Congress) | Y Leonidas F. Livingston | Democratic | 9,258 | 58.0 |
| J. C. Hendrix | Republican | 6,715 | 42.0 | |
| 1898 (56th Congress) | Y Leonidas F. Livingston | Democratic | 3,027 | 97.6 |
| 1900 (57th Congress) | Y Leonidas F. Livingston | Democratic | 8,828 | 76.6 |
| Charles I. Brannan | Independent | 2,685 | 23.3 | |
| 1902 (58th Congress) | Y Leonidas F. Livingston | Democratic | 2,485 | 100.0 |
| 1904 (59th Congress) | Y Leonidas F. Livingston | Democratic | 9,387 | 71.4 |
| C. P. Goree | Republican | 3,760 | 28.6 | |
| 1906 (60th Congress) | Y Leonidas F. Livingston | Democratic | 3,030 | 100.0 |
| 1908 (65th Congress) | Y Leonidas F. Livingston | Democratic | 8,909 | 100.0 |
| 1910 (62nd Congress) | Y William Schley Howard | Democratic | 4,091 | 100.0 |
| 1912 (63rd Congress) | Y William Schley Howard | Democratic | 12,000 | 100.0 |
| 1914 (64th Congress) | Y William Schley Howard | Democratic | 4,780 | 88.2 |
| Dewar | Progressive | 640 | 11.8 | |
| 1916 (65th Congress) | Y William Schley Howard | Democratic | 13,174 | 88.8 |
| Moore | 1,656 | 11.2 | ||
| 1918 (66th Congress) | Y William D. Upshaw | Democratic | 5,251 | 100.0 |
| 1920 (67th Congress) | Y William D. Upshaw | Democratic | 10,649 | 70.1 |
| John W. Martin | Republican | 4,544 | 29.9 | |
| 1922 (68th Congress) | Y William D. Upshaw | Democratic | 4,646 | 93.1 |
| Max H. Wilensky | 347 | 7.0 | ||
| 1924 (69th Congress) | Y William D. Upshaw | Democratic | 16,608 | 100.0 |
| 1926 (70th Congress) | Y Leslie J. Steele | Democratic | 2,919 | 99.9 |
| 1928 (75th Congress) | Y Leslie J. Steele | Democratic | 19,328 | 100.0 |
| October 2, 1929 (75th Congress) Special election | Y Robert Ramspeck | Democratic | ||
| 1930 (72nd Congress) | Y Robert Ramspeck | Democratic | 10,752 | 100.0 |
| 1932 (73rd Congress) | Y Robert Ramspeck | Democratic | 26,657 | 100.0 |
| 1934 (74th Congress) | Y Robert Ramspeck | Democratic | 5,206 | 100.0 |
| 1936 (75th Congress) | Y Robert Ramspeck | Democratic | 35,540 | 89.4 |
| H. H. Alexander | Republican | 4,213 | 10.6 | |
| 1938 (76th Congress) | Y Robert Ramspeck | Democratic | 6,906 | 97.2 |
| 1940 (77th Congress) | Y Robert Ramspeck | Democratic, Independent | 41,677 | 99.9 |
| 1942 (78th Congress) | Y Robert Ramspeck | Democratic | 9,176 | 96.0 |
| 1944 (79th Congress) | Y Robert Ramspeck | Democratic | 50,257 | 94.5 |
| H. H. Alexander | Independent | 2,929 | 5.5 | |
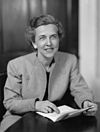
| February 12, 1946 (79th Congress) Special election | Y Helen Douglas Mankin | Democratic | ||
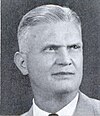
| 1946 (80th Congress) | Y James C. Davis | Democratic | 31,444 | 61.6 |
| Helen Douglas Mankin | Independent (Write-in) | 19,527 | 38.3 | |
| 1948 (85th Congress) | Y James C. Davis | Democratic | 54,637 | 99.6 |
| 1950 (82nd Congress) | Y James C. Davis | Democratic | 49,317 | 100.0 |
| 1952 (83rd Congress) | Y James C. Davis | Democratic | 83,920 | 100.0 |
| 1954 (84th Congress) | Y James C. Davis | Democratic | 54,069 | 64.4 |
| Charles A. Moye Jr. | Republican | 29,911 | 35.6 | |
| 1956 (85th Congress) | Y James C. Davis | Democratic | 85,292 | 59.2 |
| Randolph W. Thrower | Republican | 58,777 | 40.8 | |
| 1958 (86th Congress) | Y James C. Davis | Democratic | 32,135 | 100.0 |
| 1960 (87th Congress) | Y James C. Davis | Democratic | 80,023 | 99.7 |
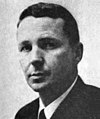
| 1962 (88th Congress) | Y Charles Weltner | Democratic | 60,583 | 55.6 |
| L. J. O'Callaghan | Republican | 48,466 | 44.4 | |
| 1964 (89th Congress) | Y Charles Weltner | Democratic | 65,803 | 54.0 |
| L. J. O'Callaghan | Republican | 55,983 | 46.0 | |
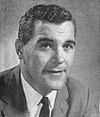
| 1966 (90th Congress) | Y Fletcher Thompson | Republican | 55,423 | 60.1 |
| Archie Lindsey | Democratic | 36,751 | 39.9 | |
| 1968 (95th Congress) | Y Fletcher Thompson | Republican | 79,258 | 55.6 |
| Charles Weltner | Democratic | 63,183 | 44.4 | |
| 1970 (92nd Congress) | Y Fletcher Thompson | Republican | 78,540 | 57.4 |
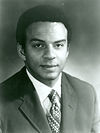
| Andrew Young | Democratic | 58,394 | 42.6 | |
| 1972 (93rd Congress) | Y Andrew Young | Democratic | 72,289 | 52.8 |
| Rodney M. Cook | Republican | 64,495 | 47.1 | |
| 1974 (94th Congress) | Y Andrew Young | Democratic | 69,221 | 71.6 |
| Wyman C. Lowe | Republican | 27,397 | 28.3 | |
| 1976 (95th Congress) | Y Andrew Young | Democratic | 96,056 | 66.7 |
| Ed Gadrix | Republican | 47,998 | 33.3 | |
| 1977 (95th Congress) Special election | Wyche Fowler | Democratic | 29,898 | 39.6 |
| John Lewis | Democratic | 21,531 | 28.6 | |
| Paul Coverdell | Republican | 16,509 | 21.9 | |
| April 5, 1977 (95th Congress) Special runoff | Y Wyche Fowler | Democratic | 54,378 | 62.4 |
| John Lewis | Democratic | 32,732 | 37.6 | |
| 1978 (96th Congress) | Y Wyche Fowler | Democratic | 52,739 | 75.5 |
| Thomas P. Bowles Jr. | Republican | 17,132 | 24.5 | |
| 1980 (97th Congress) | Y Wyche Fowler | Democratic | 101,646 | 74.0 |
| F. William Dowda | Republican | 35,640 | 26.0 | |
| 1982 (98th Congress) | Y Wyche Fowler | Democratic | 53,264 | 80.8 |
| J.E. (Billy) McKinney | Independent | 9,047 | 13.7 | |
| Paul Jones | Republican | 3,633 | 5.5 | |
| 1984 (99th Congress) | Y Wyche Fowler | Democratic | 151,233 | 100.0 |
| 1986 (100th Congress) | Y John Lewis | Democratic | 93,229 | 75.3 |
| Portia A. Scott | Republican | 30,562 | 24.7 | |
| 1988 (105th Congress) | Y John Lewis | Democratic | 135,194 | 78.2 |
| J. W. Tibbs Jr. | Republican | 37.693 | 21.8 | |
| 1990 (102nd Congress) | Y John Lewis | Democratic | 86,037 | 75.6 |
| J. W. Tibbs Jr. | Republican | 27,781 | 24.4 | |
| 1992 (103rd Congress) | Y John Lewis | Democratic | 147,445 | 72.1 |
| Paul R. Stabler | Republican | 56,960 | 27.9 | |
| 1994 (104th Congress) | Y John Lewis | Democratic | 85,094 | 69.1 |
| Dale Dixon | Republican | 37,999 | 30.9 | |
| 1996 (105th Congress) | Y John Lewis | Democratic | 136,555 | 100.0 |
| 1998 (106th Congress) | Y John Lewis | Democratic | 109,177 | 78.5 |
| John H. Lewis Sr. | Republican | 29,877 | 21.5 | |
| 2000 (107th Congress) | Y John Lewis | Democratic | 137,333 | 77.2 |
| Hank Schwab | Republican | 40,606 | 22.8 | |
| 2002 (108th Congress) | Y John Lewis | Democratic | 116,259 | 100.0 |
| 2004 (109th Congress) | Y John Lewis | Democratic | 201,773 | 100.0 |
| 2006 (110th Congress) | Y John Lewis | Democratic | 122,380 | 100.0 |
| 2008 (111th Congress) | Y John Lewis | Democratic | 122,345 | 100.0 |
2002
| Party | Candidate | Votes | % | |
|---|---|---|---|---|
| Democratic | John Lewis (Incumbent) | 116,230 | 100.00 | |
| Total votes | 116,230 | 100.00 | ||
| Turnout | ||||
| Democratic hold | ||||
2004
| Party | Candidate | Votes | % | |
|---|---|---|---|---|
| Democratic | John Lewis (Incumbent) | 201,773 | 100.00 | |
| Total votes | 201,773 | 100.00 | ||
| Turnout | ||||
| Democratic hold | ||||
2006
| Party | Candidate | Votes | % | |
|---|---|---|---|---|
| Democratic | John Lewis (Incumbent) | 122,380 | 99.95 | |
| No party | Others | 64 | 0.05 | |
| Total votes | 122,444 | 100.00 | ||
| Turnout | ||||
| Democratic hold | ||||
2008
| Party | Candidate | Votes | % | |
|---|---|---|---|---|
| Democratic | John Lewis (Incumbent) | 231,368 | 99.95 | |
| No party | Others | 106 | 0.05 | |
| Total votes | 231,437 | 100.00 | ||
| Turnout | ||||
| Democratic hold | ||||
2010
| Party | Candidate | Votes | % | |
|---|---|---|---|---|
| Democratic | John Lewis (Incumbent) | 130,782 | 73.72 | |
| Republican | Fenn Little | 46,622 | 26.28 | |
| Total votes | 177,404 | 100.00 | ||
| Turnout | ||||
| Democratic hold | ||||
2012
| Party | Candidate | Votes | % | |
|---|---|---|---|---|
| Democratic | John Lewis (Incumbent) | 234,330 | 84.39 | |
| Republican | Howard Stopeck | 43,335 | 15.61 | |
| Total votes | 277,665 | 100.00 | ||
| Turnout | ||||
| Democratic hold | ||||
2014
| Party | Candidate | Votes | % | |
|---|---|---|---|---|
| Democratic | John Lewis (Incumbent) | 170,326 | 100 | |
| Total votes | 170,326 | 100.00 | ||
| Turnout | ||||
| Democratic hold | ||||
2016
| Party | Candidate | Votes | % | |
|---|---|---|---|---|
| Democratic | John Lewis (Incumbent) | 253,781 | 84.44 | |
| Republican | Douglas Bell | 46,768 | 15.56 | |
| Total votes | 300,549 | 100.00 | ||
| Turnout | ||||
| Democratic hold | ||||
2018
| Party | Candidate | Votes | % | |
|---|---|---|---|---|
| Democratic | John Lewis (Incumbent) | 273,084 | 100 | |
| Total votes | 273,084 | 100.00 | ||
| Turnout | ||||
| Democratic hold | ||||
2020 special election
| Party | Candidate | Votes | % | |
|---|---|---|---|---|
| Democratic | Kwanza Hall | 11,104 | 31.75% | |
| Democratic | Robert Michael Franklin Jr. | 9,987 | 28.55% | |
| Democratic | Mable Thomas | 6,692 | 19.13% | |
| Democratic | Keisha Waites | 4,255 | 12.17% | |
| Democratic | Barrington Martin II | 1,944 | 5.56% | |
| Libertarian | Chase Oliver | 712 | 2.04% | |
| Independent | Steven Muhammad | 282 | 0.8% | |
| Total votes | 34,967 | 100.00% | ||
| Party | Candidate | Votes | % | |
|---|---|---|---|---|
| Democratic | Kwanza Hall | 13,450 | 54.27% | |
| Democratic | Robert Michael Franklin Jr. | 11,332 | 45.73% | |
| Total votes | 24,782 | 100.00% | ||
| Democratic hold | ||||
2020
| Party | Candidate | Votes | % | |
|---|---|---|---|---|
| Democratic | Nikema Williams | 301,857 | 85.02 | |
| Republican | Angela Stanton-King | 52,646 | 14.08 | |
| Total votes | 354,503 | 100.00 | ||
| Democratic hold | ||||
2022
| Party | Candidate | Votes | % | |
|---|---|---|---|---|
| Democratic | Nikema Williams (incumbent) | 243,687 | 82.48 | |
| Republican | Christian Zimm | 51,769 | 17.52 | |
| Total votes | 295,456 | 100.00 | ||
| Democratic hold | ||||
See also
 United States portal
 Georgia (U.S. state) portal


References
- ^ "Congressional Districts Relationship Files (state-based)". www.census.gov. US Census Bureau Geography.
- ^ "My Congressional District". www.census.gov. Center for New Media & Promotion (CNMP), US Census Bureau.
- ^ "My Congressional District". www.census.gov. Center for New Media & Promotion (CNMP), US Census Bureau.
- ^ a b "2022 Cook PVI: District Map and List". Cook Political Report. July 12, 2022. Retrieved January 10, 2023.
- ^ Justice Department approves Georgia's political maps Archived January 7, 2012, at the Wayback Machine. Atlanta Journal-Constitution. Last accessed December 27, 2011
- ^ 2012 Congressional maps - Metro Atlanta, Georgia Legislature. Last accessed January 1, 2012
- ^ Prince was seated despite the fact that Georgia had not yet been readmitted to the Union. On the opening of the 45th United States Congress in March 1869, he claimed that his election of 1868 entitled him to sit in that Congress, but this claim was rejected by Congress.
- ^ "Results Summary". Georgia Secretary of State. Retrieved September 30, 2020.
- ^ "Results Summary". Georgia Secretary of State. Retrieved December 14, 2020.
- Martis, Kenneth C. (1989). The Historical Atlas of Political Parties in the United States Congress. New York: Macmillan Publishing Company.
- Martis, Kenneth C. (1982). The Historical Atlas of United States Congressional Districts. New York: Macmillan Publishing Company.
- Congressional Biographical Directory of the United States 1774–present
External links
- PDF map of Georgia's 5th district at nationalatlas.gov
- Georgia's 5th district at GovTrack.us
- v
- t
- e
- The at-large district is obsolete.
- See also
- Georgia's past and present representatives, senators, and delegations
33°42′25″N 84°24′04″W / 33.70694°N 84.40111°W / 33.70694; -84.40111


